Capture the invisible.
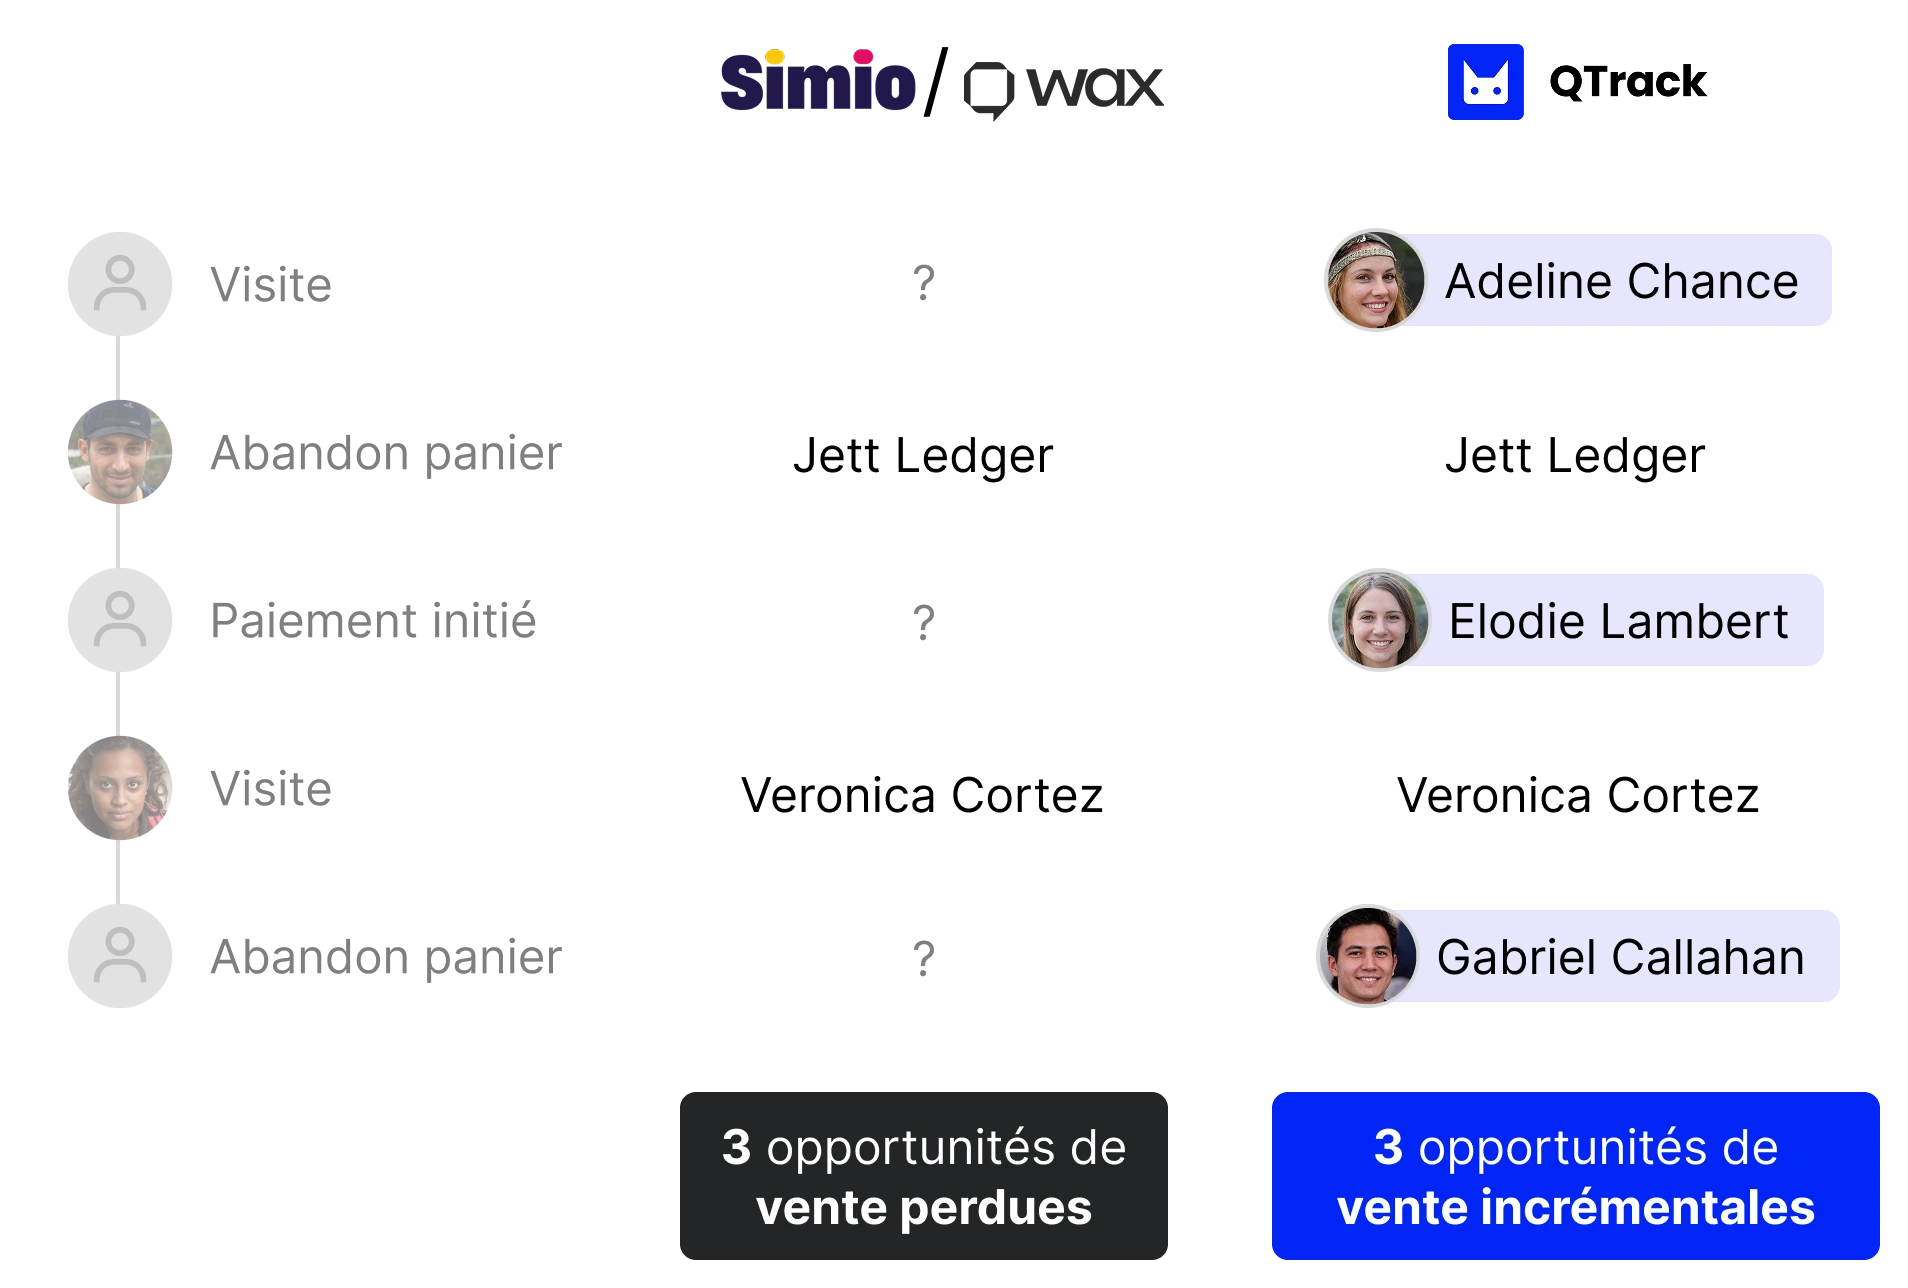
Sell to visitors that Klaviyo doesn't track.
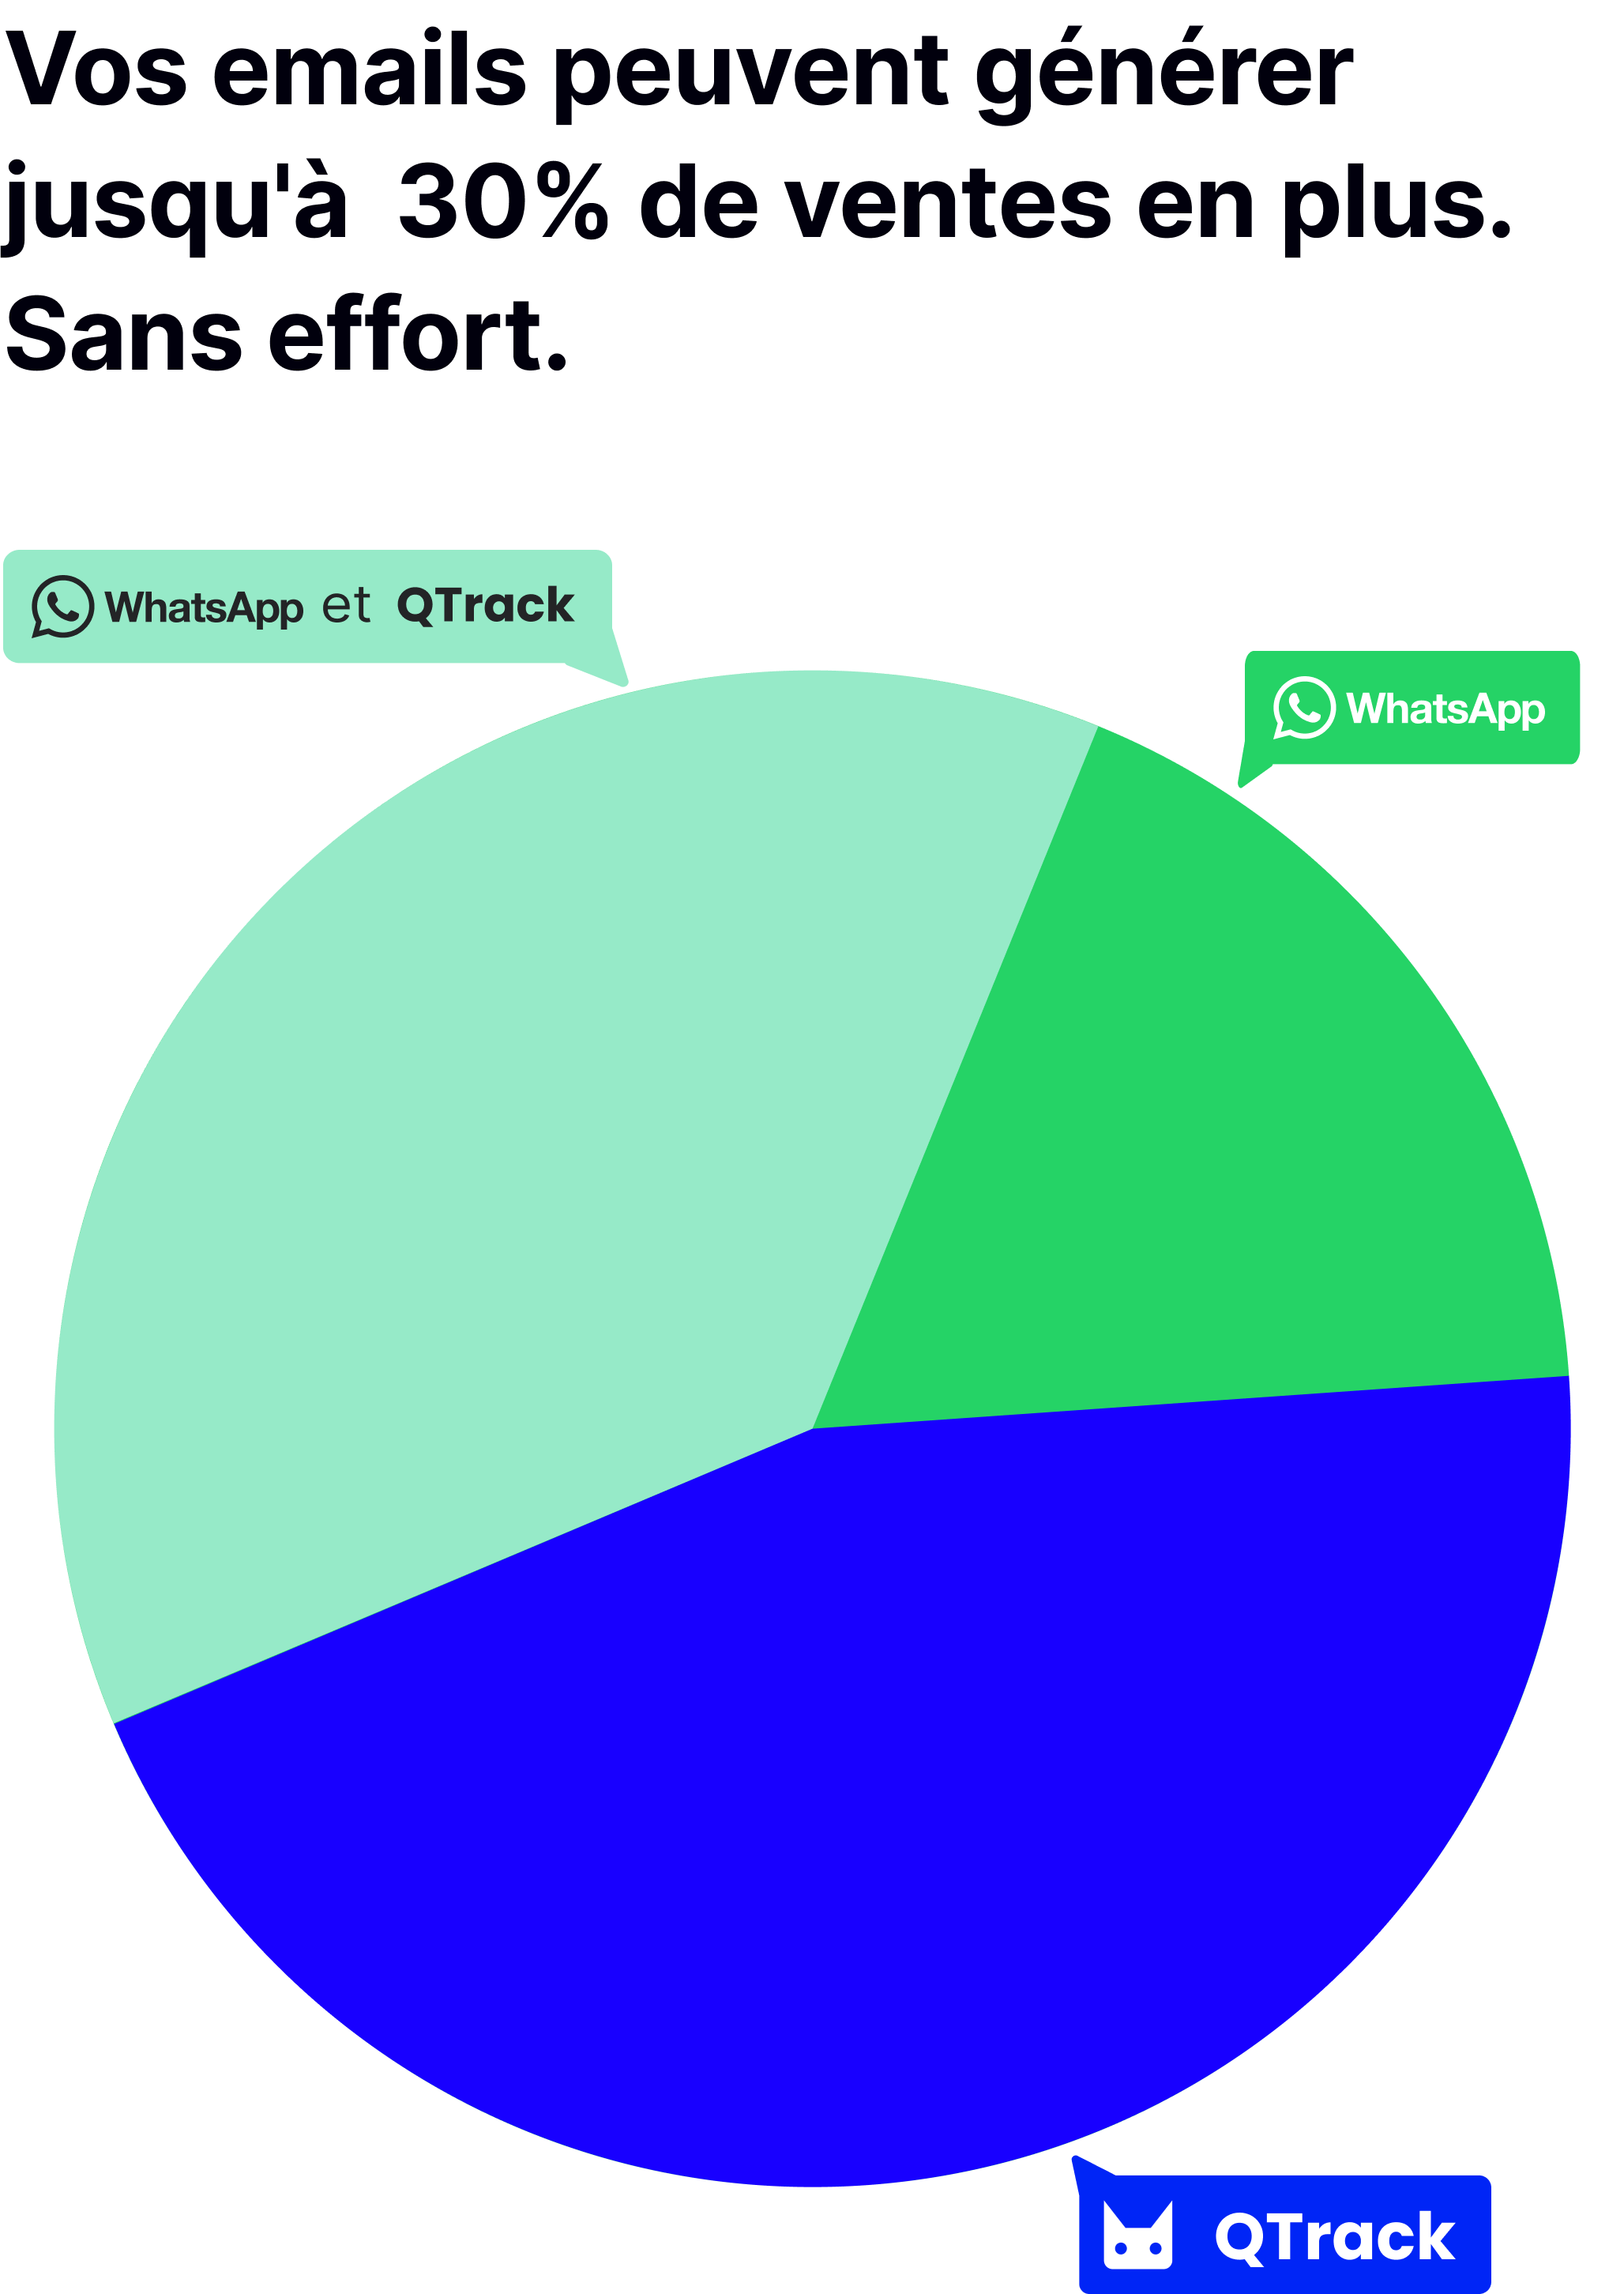
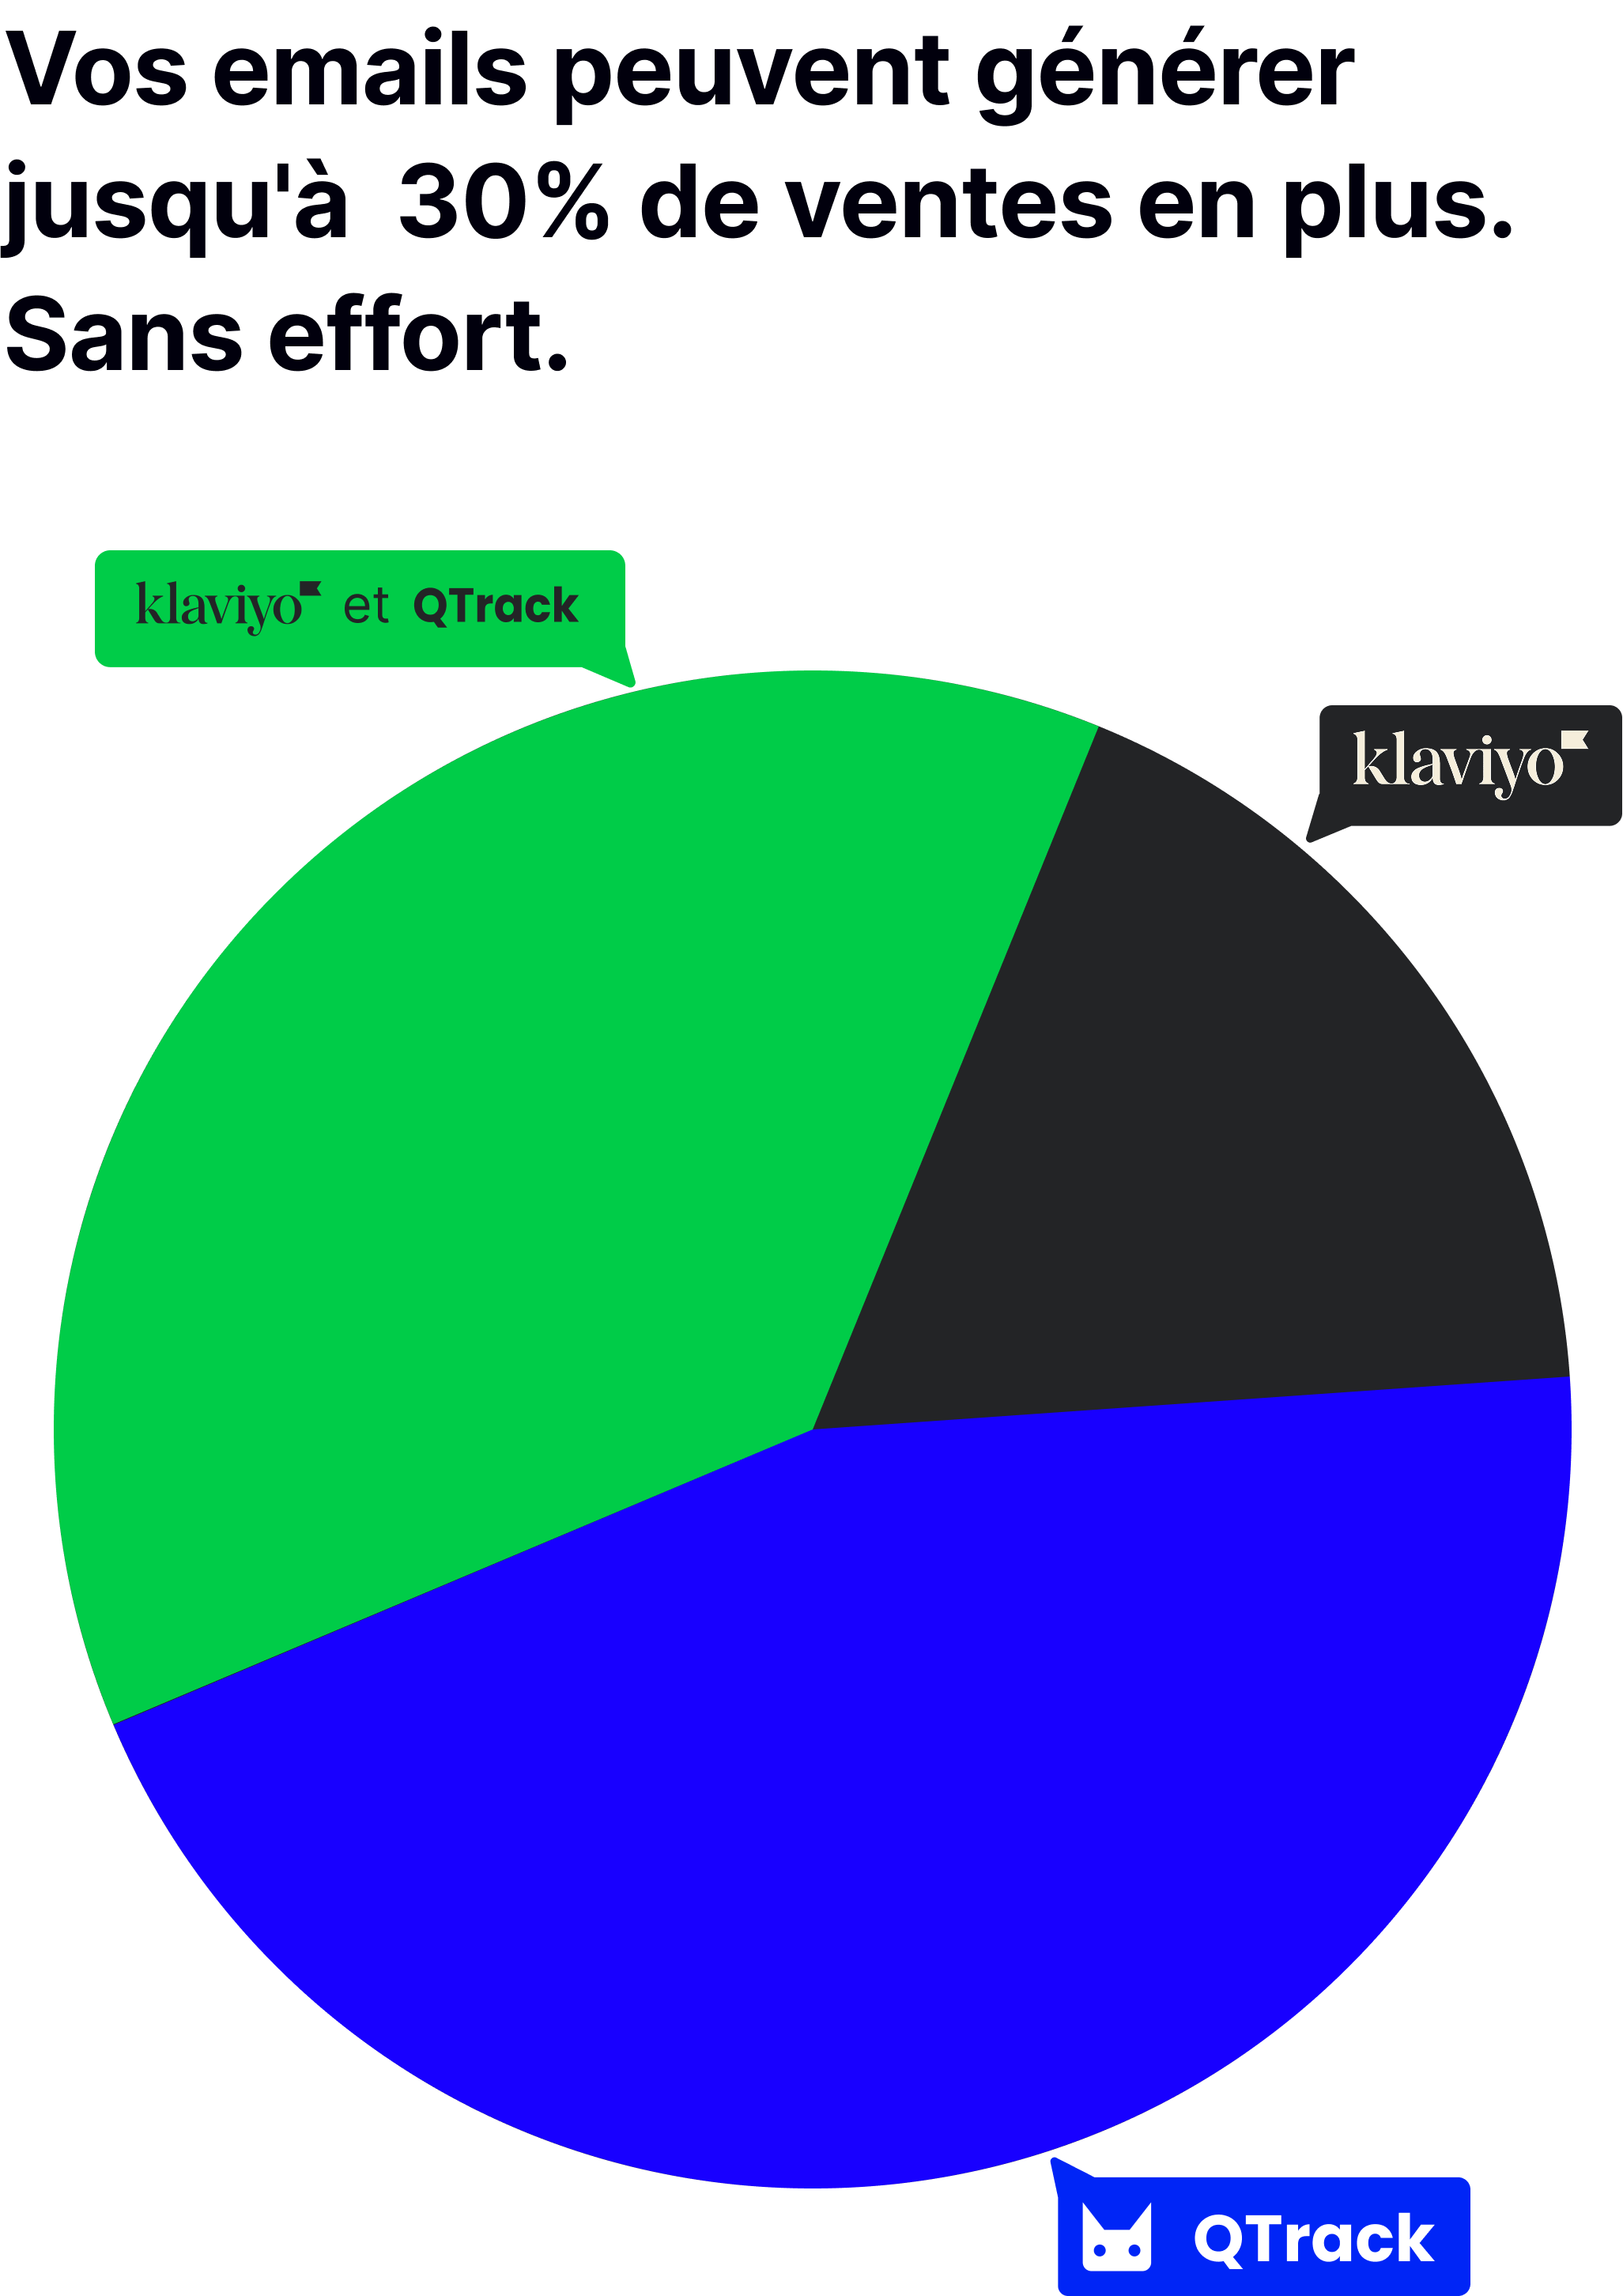
Recover up to 30% incremental turnover in your Klaviyo flows (visit, abandoned cart, payment initiated) with qTrack.

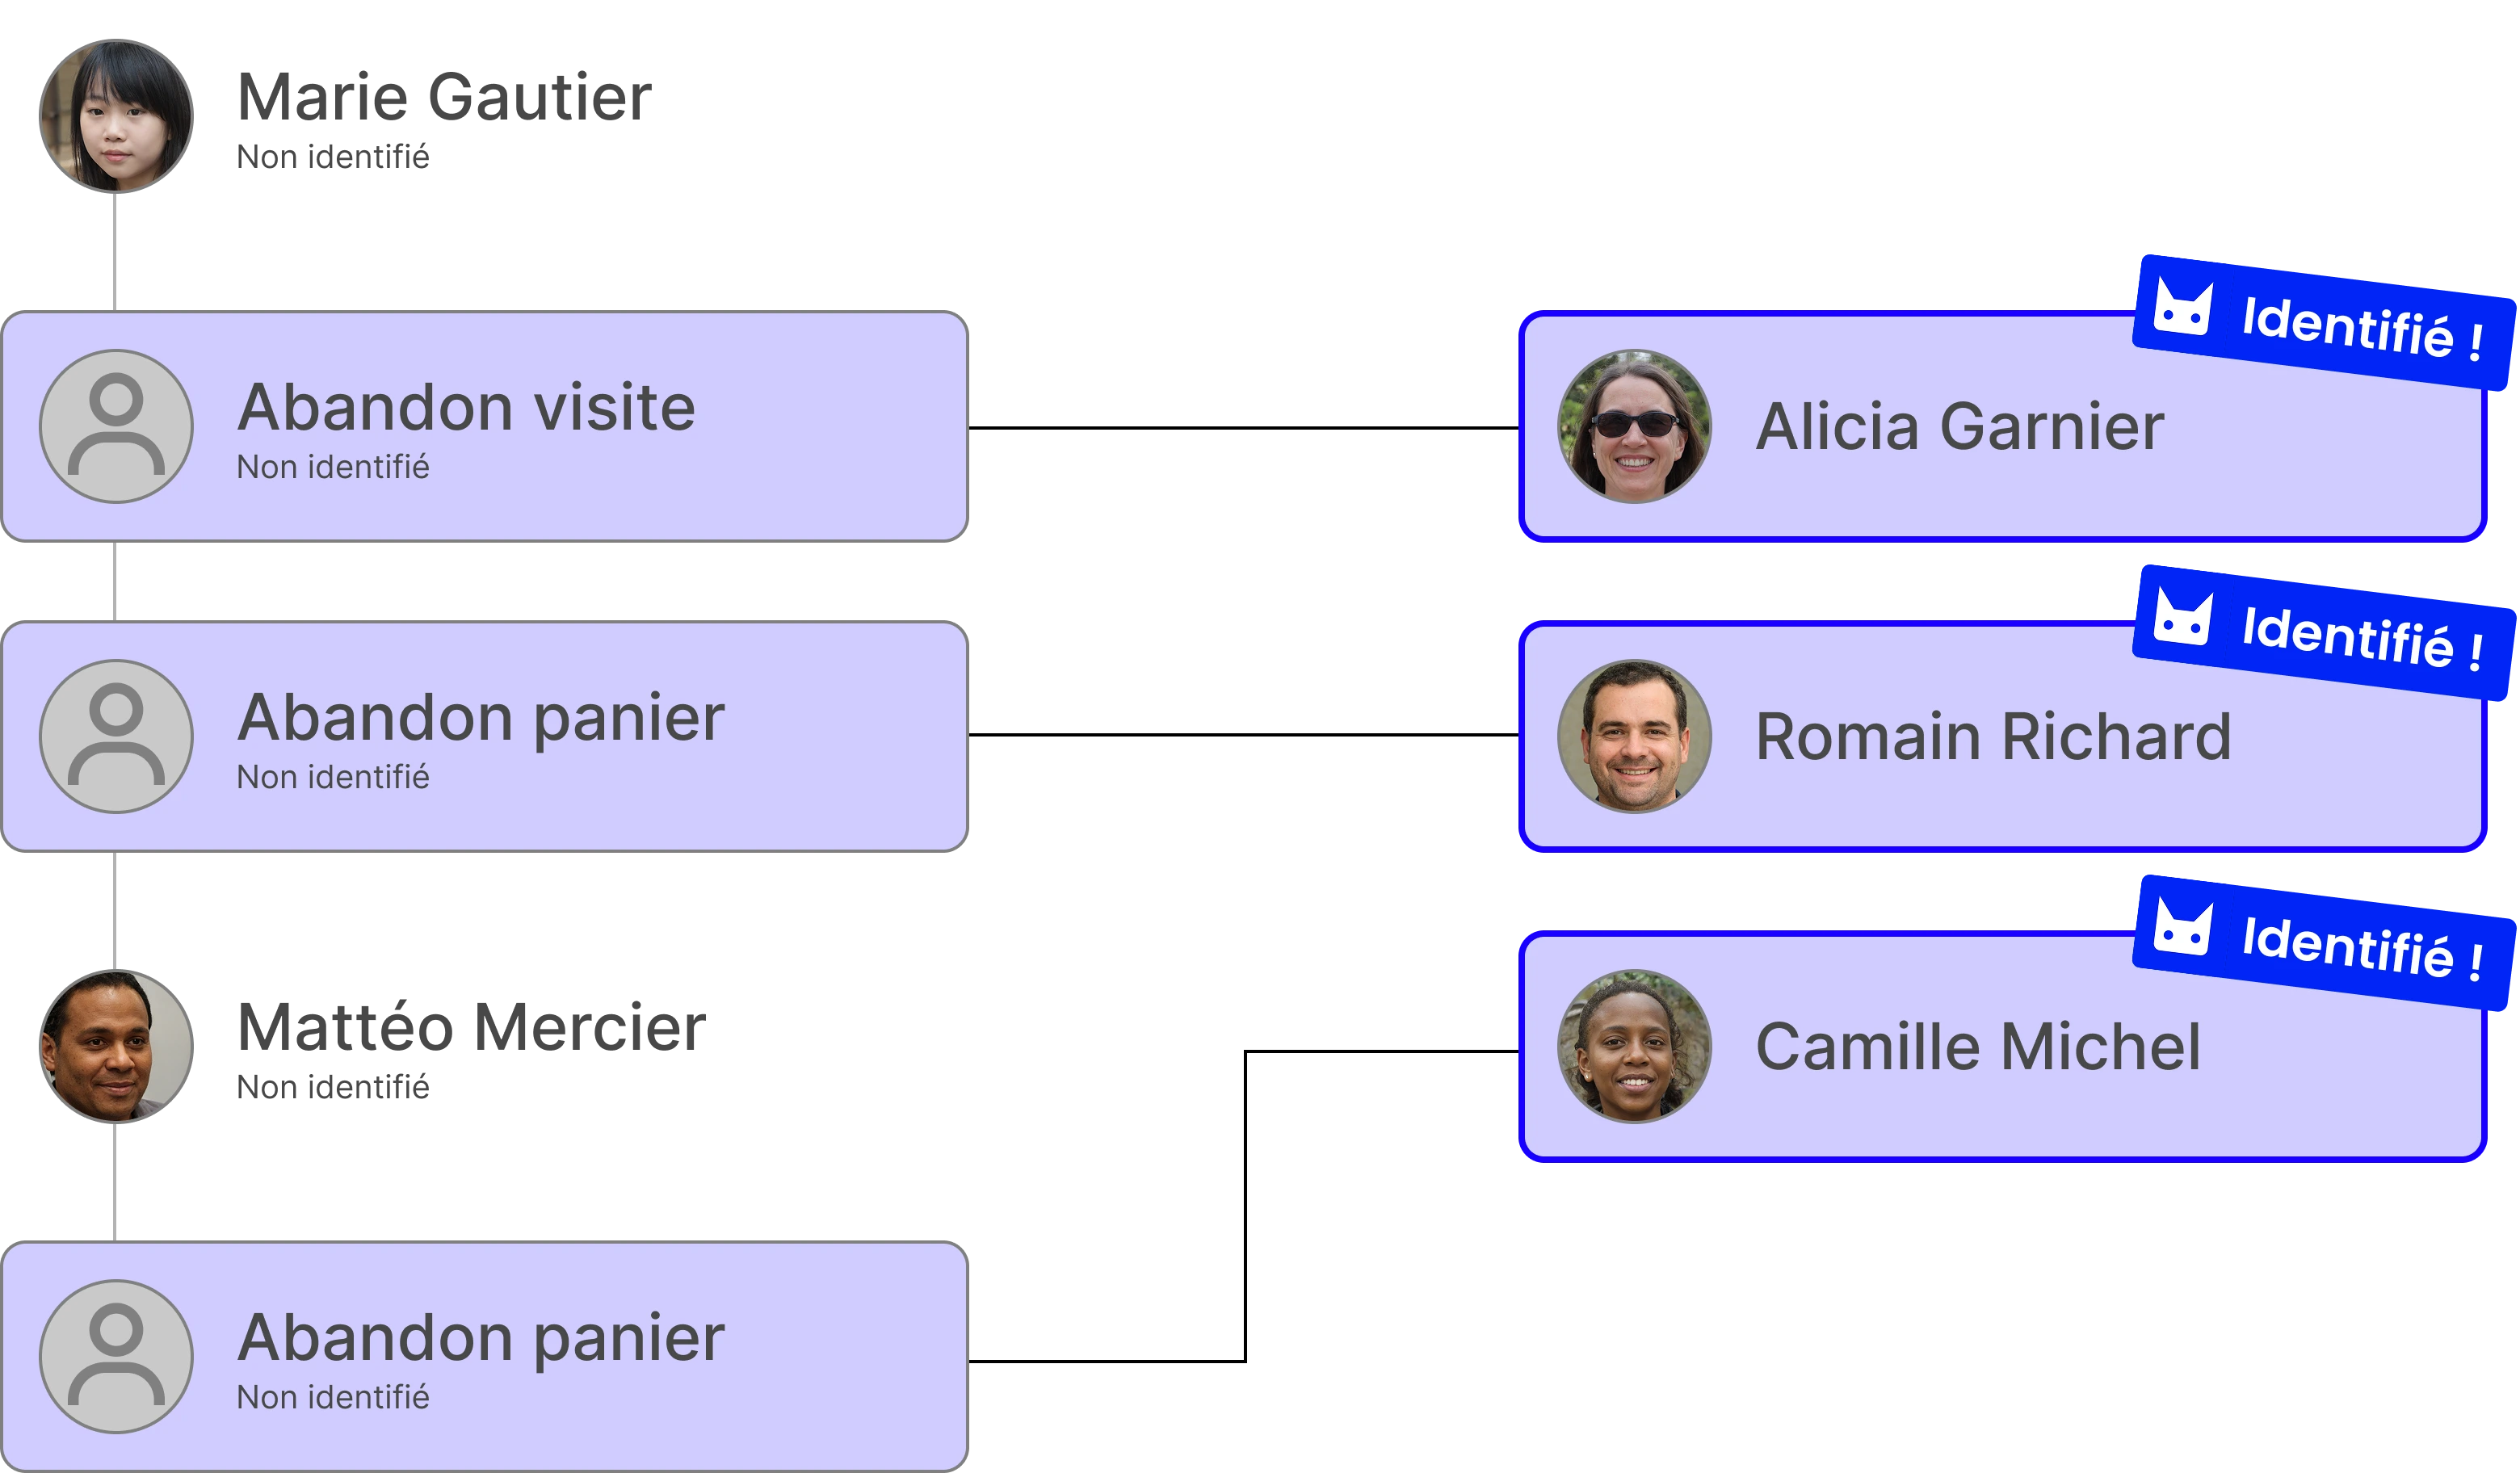
Shopify and Klaviyo no longer know who visits your site.
Blocked cookies, adblocks, RGPD, multi-device... classic tracking is no longer enough.
We recover your lost signals thanks to our first-party server tracking technology powered by AI.
Enrich your Klaviyo Flows with your own restored data
Generate up to 30% in incremental turnover thanks to your email flows by reactivating invisible visitors and abandoners.
Increase the income from your Klaviyo Flows in 15 days
Manucurist has a Monthly ROI of 37 on its cart abandonment, checkout and visit flows thanks to QTrack.
Nutrimuscle generated +34% in sales On its flow of abandoned visits in 15 days.
Naali generates a ROI of 14 every month thanks to flows QTrack.

RiveDroite generates every month 13x the price Of his subscription QTrack.
Kookai generated +46% in sales on its cart abandonment flows in only 3 weeks And has a ROI of 31 each month.

Petite Mendigote has a ROI of 25 on its cart abandonment, checkout and visit flows thanks to QTrack.