You're no longer just tracking sales, you're tracking their quality.
First purchases, repeat customers, top buyers: each order has its place.
Already adopted by 150+ e-retailers in France
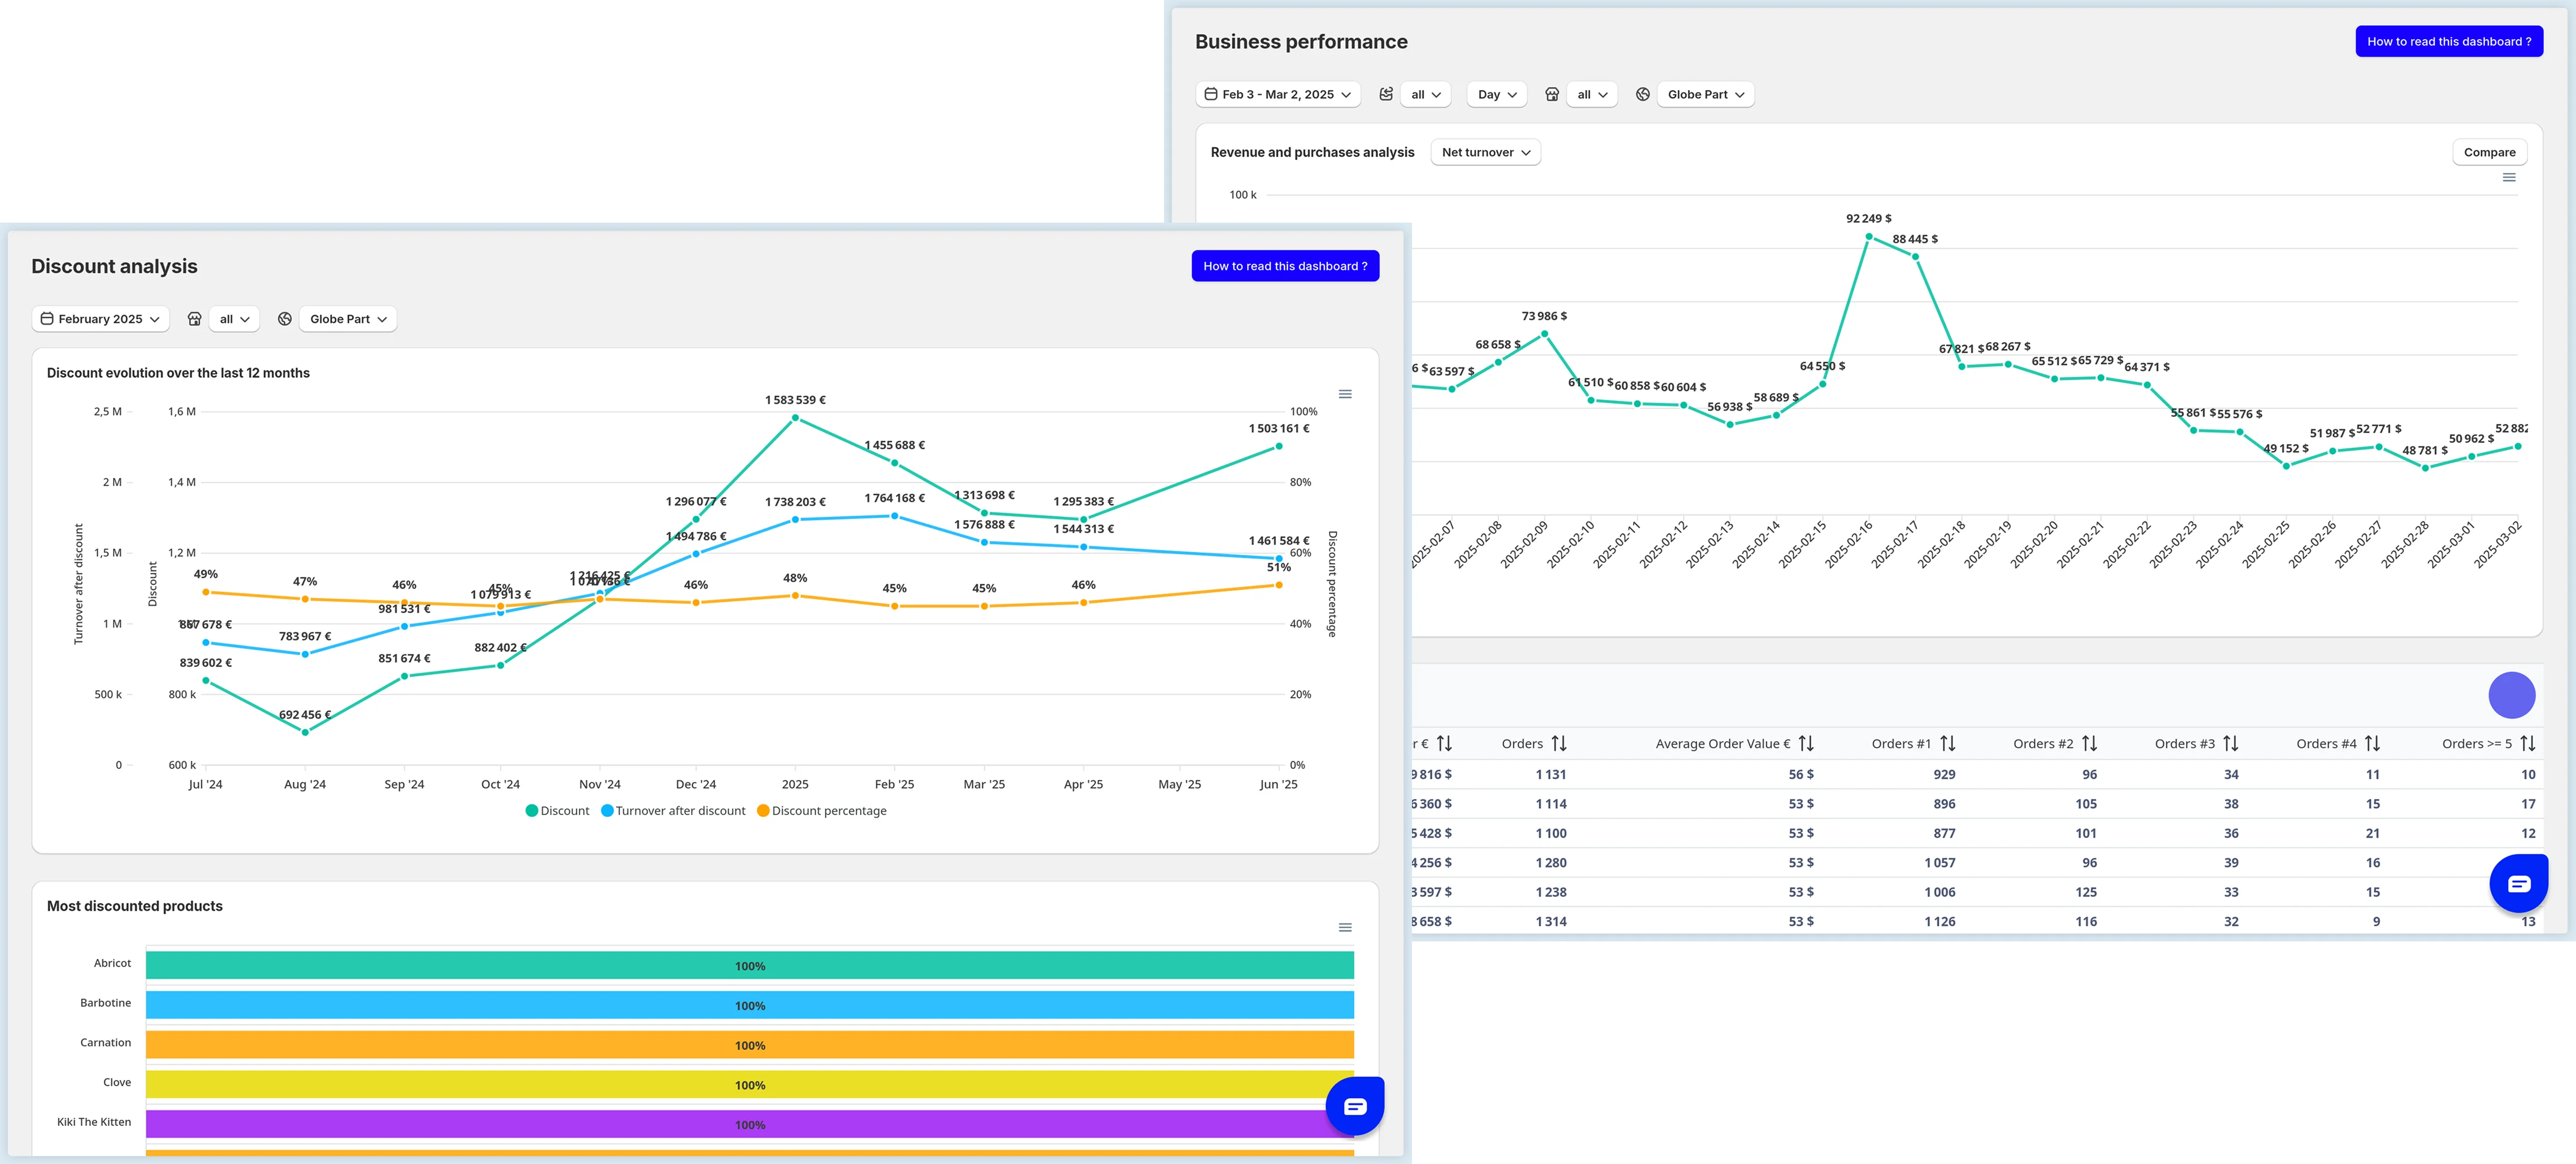
A complete vision of your performance
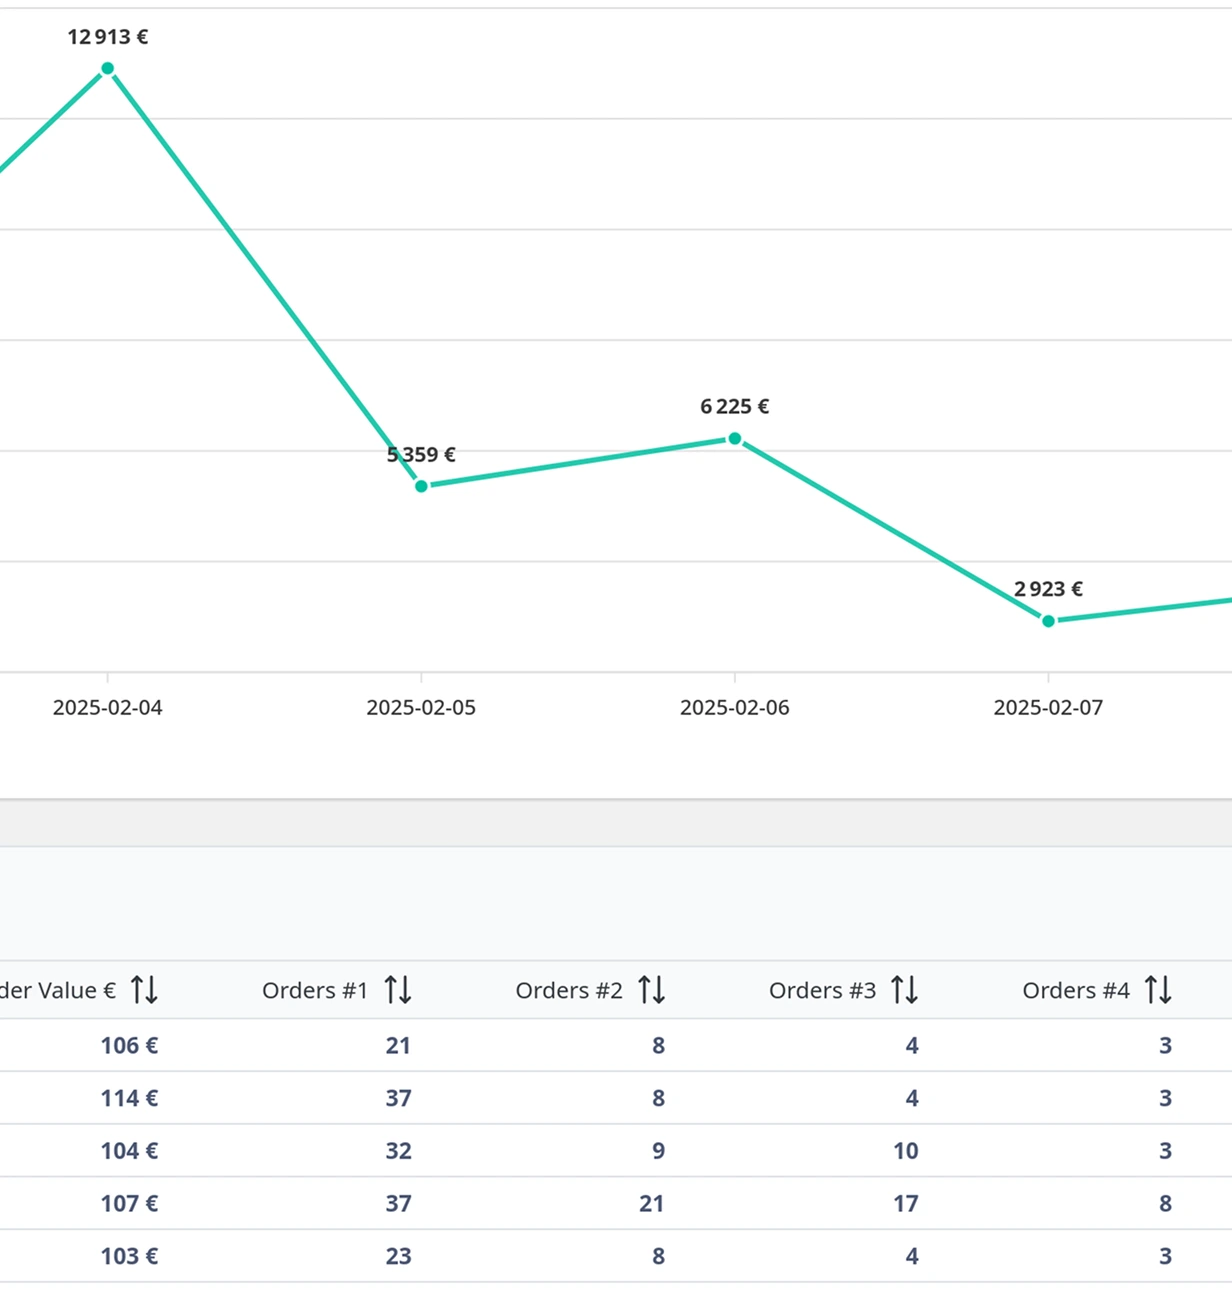
The Business Performance dashboard gives you an overview of your activity:
- Sales, average basket, number of orders,
- repurchase rate (2nd, 3rd, 4th, 5th order+),
- identification of trends and trends
No more CSV exports to be reprocessed. In a few seconds, you can see what is supporting or hindering your growth.
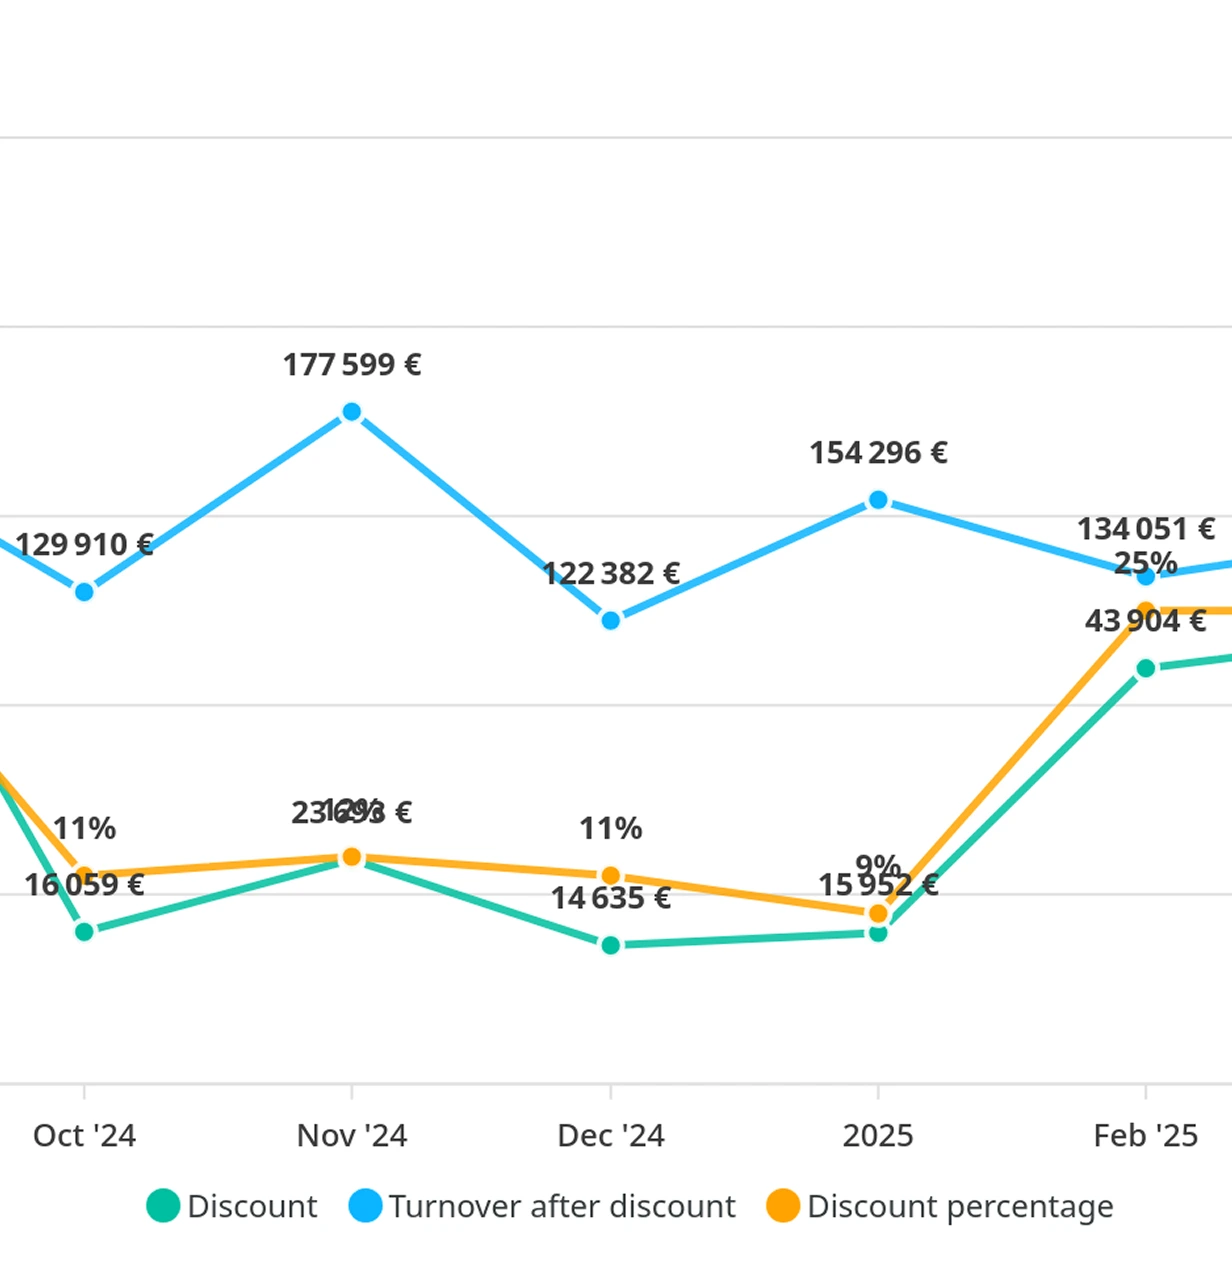
Discounts, under control. At last.
The “Discount Analysis” dashboard helps you regain control over your discounts:
- monthly change in turnover after discounts,
- average discount percentage applied,
- top most discounted products
- most used top codes
- The most discounted top utm
You visualize the impact of promotions on your margins, and identify products that are harmful to your profitability. The key: smarter trade-offs, and protected margins.
Dilly, the AI that brings your dashboards to life
And to go further, Dilly accompanies you. It is your AI co-pilot, connected to your dashboards, who answers your questions in natural language and offers you:
- Clear analyses,
- Concrete recommendations,
- Benchmarks to help you locate yourself
Examples:
“What has my repurchase rate been since January?”
“What products have been discounted the most in the last 30 days?”
“What percentage share do I offer my customers every year?”
Dilly reads the data for you. And tells you what to do.